05
Robustness Checks & Diagnostics
Testing for Heteroskedasticity (Breusch-Pagan Test)
Given the borderline p-value for PM2.5 (p = 0.052), it is crucial to justify our model specification. A core assumption of OLS is homoskedasticity. We performed the Breusch-Pagan test on the Fixed Effects model.
| Lagrange multiplier statistic: | 13.9103 |
| p-value: | 0.2380 |
| f-value: | 1.3413 |
| f p-value: | 0.2227 |
Interpretation: Since the p-value (> 0.05) is not significant, we fail to reject the null hypothesis of homoskedasticity, meaning our standard errors are robust and reliable.
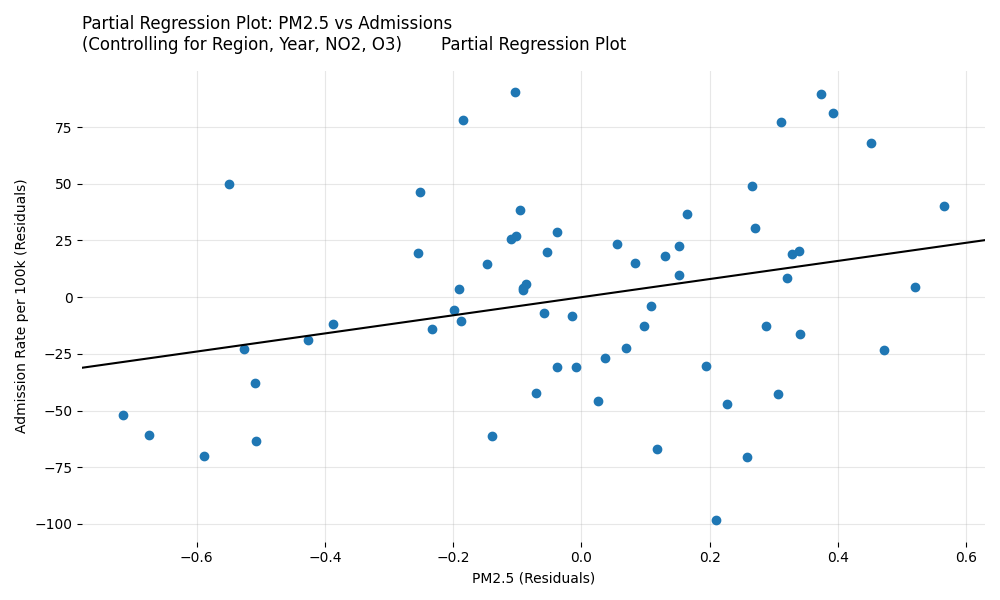
Partial Regression Plot for PM2.5
This plot isolates the true independent effect of PM2.5 on hospital admissions after statistically partialling out the confounding effects of region, year, NO2, and O3.